Download pdf: Measuring potassium in soil and crop (2.61M)
pdf 2.61M
Measuring potassium in soil and crop
June 2014

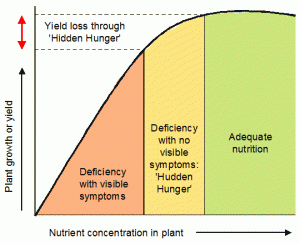
At a time when a crop is looking at its best, as is usually the case at this time of year, there may be little incentive to think about deficiencies. However crops can appear to be perfectly well fed yet still be deficient in potash. This ‘invisible’ deficiency is often referred to as ‘hidden hunger’, a problem illustrated in Figure 1. The result of such unseen deficiencies may be seen as a reduction in yield or quality, which is often attributed to other causes such as the weather, or even accepted as the norm.
Such hidden hunger for potassium can be avoided by maintaining soil potash reserves at an adequate level, usually in Index 2. This is determined by standard regular soil analysis, with deficiency being indicated when soil is at Index 0 or 1. As has been mentioned in earlier Newsletters there will probably be considerable variability in nutrient status across the field, so that even at Index 2 there may be areas in the field at Index 1, and when the field average is Index 1, many areas may well be at Index 0. Problems caused by such spatially variable nutrient reserves can be managed by variable rate fertiliser spreading. In fact patches of low nutrient reserve are often associated with the highest-yielding parts of a field, where the greatest removal of nutrients occurs at harvest. It can be worthwhile to take samples (with a minimum of 16 cores per sample) in any identifiable high-yield areas and to compare the result of these analyses with the average for the field. If these areas have a lower nutrient status some correction can be achieved by simply spreading extra nutrient specifically in these areas, in addition to the normal field application.

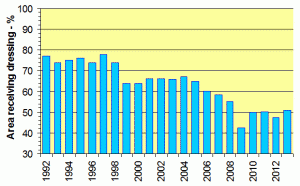
Over the years the British Survey of Fertiliser Practice (BSFP) has monitored the application rates of mineral fertilisers used on arable and grassland. It also records the percentages of crop areas which receive dressings of fertilisers and manures. It is clear from Figure 2 that in recent years only about half the arable crop land in GB is receiving a dressing of potash. It might be hoped that the crops not receiving potash would get a dressing of manure, but the BSFP reports that only just over 20% of the arable crop area receives manure. These data suggest a potential shortfall in potash supply on arable crops, and provide a warning that perhaps many growers hoping for high yields from good-looking crops may be disappointed because they are suffering from hidden hunger.
Tissue analysis for potash.

One of the principal functions of potassium (K) in the plant is to maintain cell turgor (by internal osmotic pressure). As 80-90% of each living cell is water, the plant has to maintain a high concentration of solutes to maintain turgidity by osmosis; K is the plant’s preferred osmoticum. Without this turgor a leaf will wilt, stomata will close restricting CO2 intake and energy capture from sunlight, carbon fixation and dry matter production are lessened.
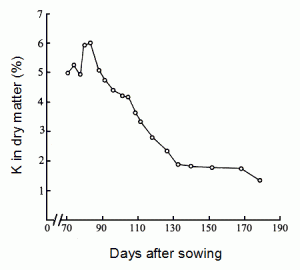
There is thus a relationship between the K content of the plant tissue and its water content; the greater the crop biomass and the more green cells it has, the greater the tissue water and total K content. However, as the crop grows the ratio of dry matter (DM) to total plant weight increases (i.e. the ratio of water to DM decreases) so the total K content when expressed as a percentage of the total DM also decreases. This is illustrated in Figure 3 for spring barley; as the crop grew and total DM increased, K% in the DM declined throughout growth. It can therefore be difficult to assess whether or not a crop has a sufficient supply of K from measurement of the percent K in the DM. This situation is only really an issue with macronutrient assessment of K status (which is related to water content) whereas the N and P contents are associated with structural elements and adequacy of supply can be judged from the content in the DM. However, for crops which are harvested well before maturity, such as silage or some green vegetables for example, the K% in the DM is likely to remain high and can be used indicate soil K supply.

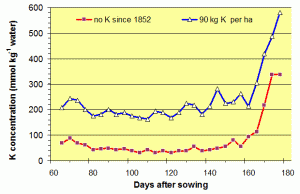
There is an advantage in assessing the K status of a crop as the concentration of K in the tissue water, as illustrated in Figure 4. A significant difference can easily be seen between an adequate and severely deficient supply of K to this spring barley crop, and this distinction is constant and apparent over the period of active growth and DM production.
There are unfortunately difficulties in reporting K as a concentration in tissue water because the laboratory will need to receive the plant material with its full content of tissue water (i.e. without any loss through wilting etc.) in order to measure the initial fresh weight of the sample before drying and determination of the dry weight and K content. The maintenance throughout growth of an adequate K concentration in the tissue water of about 200 mmol K/kg shown in Figure 4 is equivalent to about 0.8% K in the tissue water. For a sample at 20% dry matter this equates to about 4% K in the dry matter. Figure 3 shows that the concentration of K in the DM exceeded 4% for the first 100 days after sowing, in this case a spring sown crop. Thus if crop sampling and analysis are done within this period of vigorous early spring growth then a percent K in dry matter of 4% and above would indicate that the soil K supply was adequate. Values below 4% in this period of growth would suggest K deficiency.

